ACT Results 2019

Increased Scores, but Fewer Participants
By: Ashley N. Donaldson & Evan Rhinesmith, Ph.D.
Missouri’s ACT results are in for the class of 2019! We’ve had some changes for the ACT in recent years, as the universal participation policy is done. Between 2018 and 2018, we had a 100% participation rate, but this fell to 82% in 2019. This change in participation signals that students who at least have an interest in applying to college—and have likely participated in college preparatory behaviors—are taking the ACT in Missouri. It’s important to note that as Missouri’s ACT participation increased, the average score decreased. With the drop in participation this year, the average ACT score moved back up.

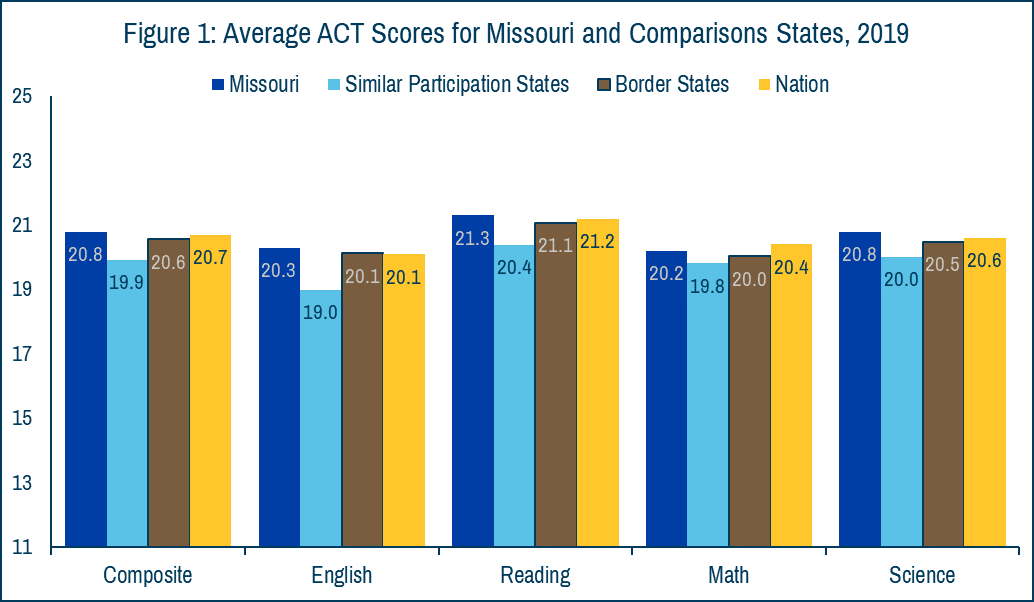
Because of this change in Missouri’s participation rate, it’s important to compare our state’s performance to other states with similar participation rates. Coincidentally, Missouri’s border states have an average participation rate that is similar to Missouri’s. When we compare the overall performance and performance on each section of the test, Missouri did better than both of these comparison groups. The only section where Missouri did not outperform the national average was math.
Part of the ACT is to test whether students intending to enroll in college are prepared for their first-year coursework. This is based on ACT’s readiness benchmarks. The ACT states that meeting the benchmark in each section leads to students having roughly a 50 percent chance of earning a B or higher or roughly a 75 percent chance of obtaining a C or higher in the corresponding introductory level college course. The English section was by far Missouri’s best seciton, as 62% of the class of 2019 met or exceeded the benchmark score. However, only 25% met the benchmark in all four subjects.

While the ACT does provide opportunities to compare performance across states, not every state has equal participation. This change has likely led to only students who intend to apply to college taking the test. To fully understand how students are performing over time compared to other states it is better to look at the results of the NAEP exam, which we do in our new policy brief on the 2019 NAEP results.