Growth Reports
Growth Reports Database


Growth Dashboard
We are excited to introduce the beta-version of the PRiME Growth Scores Data Dashboard. The data shown reflects the numbers from the most recent 3rd Edition Growth Reports, released Spring 2024. We are working to continually improve the dashboard, so please check back frequently to see any updates. If the Growth Dashboard does not appear, please refresh your browser.
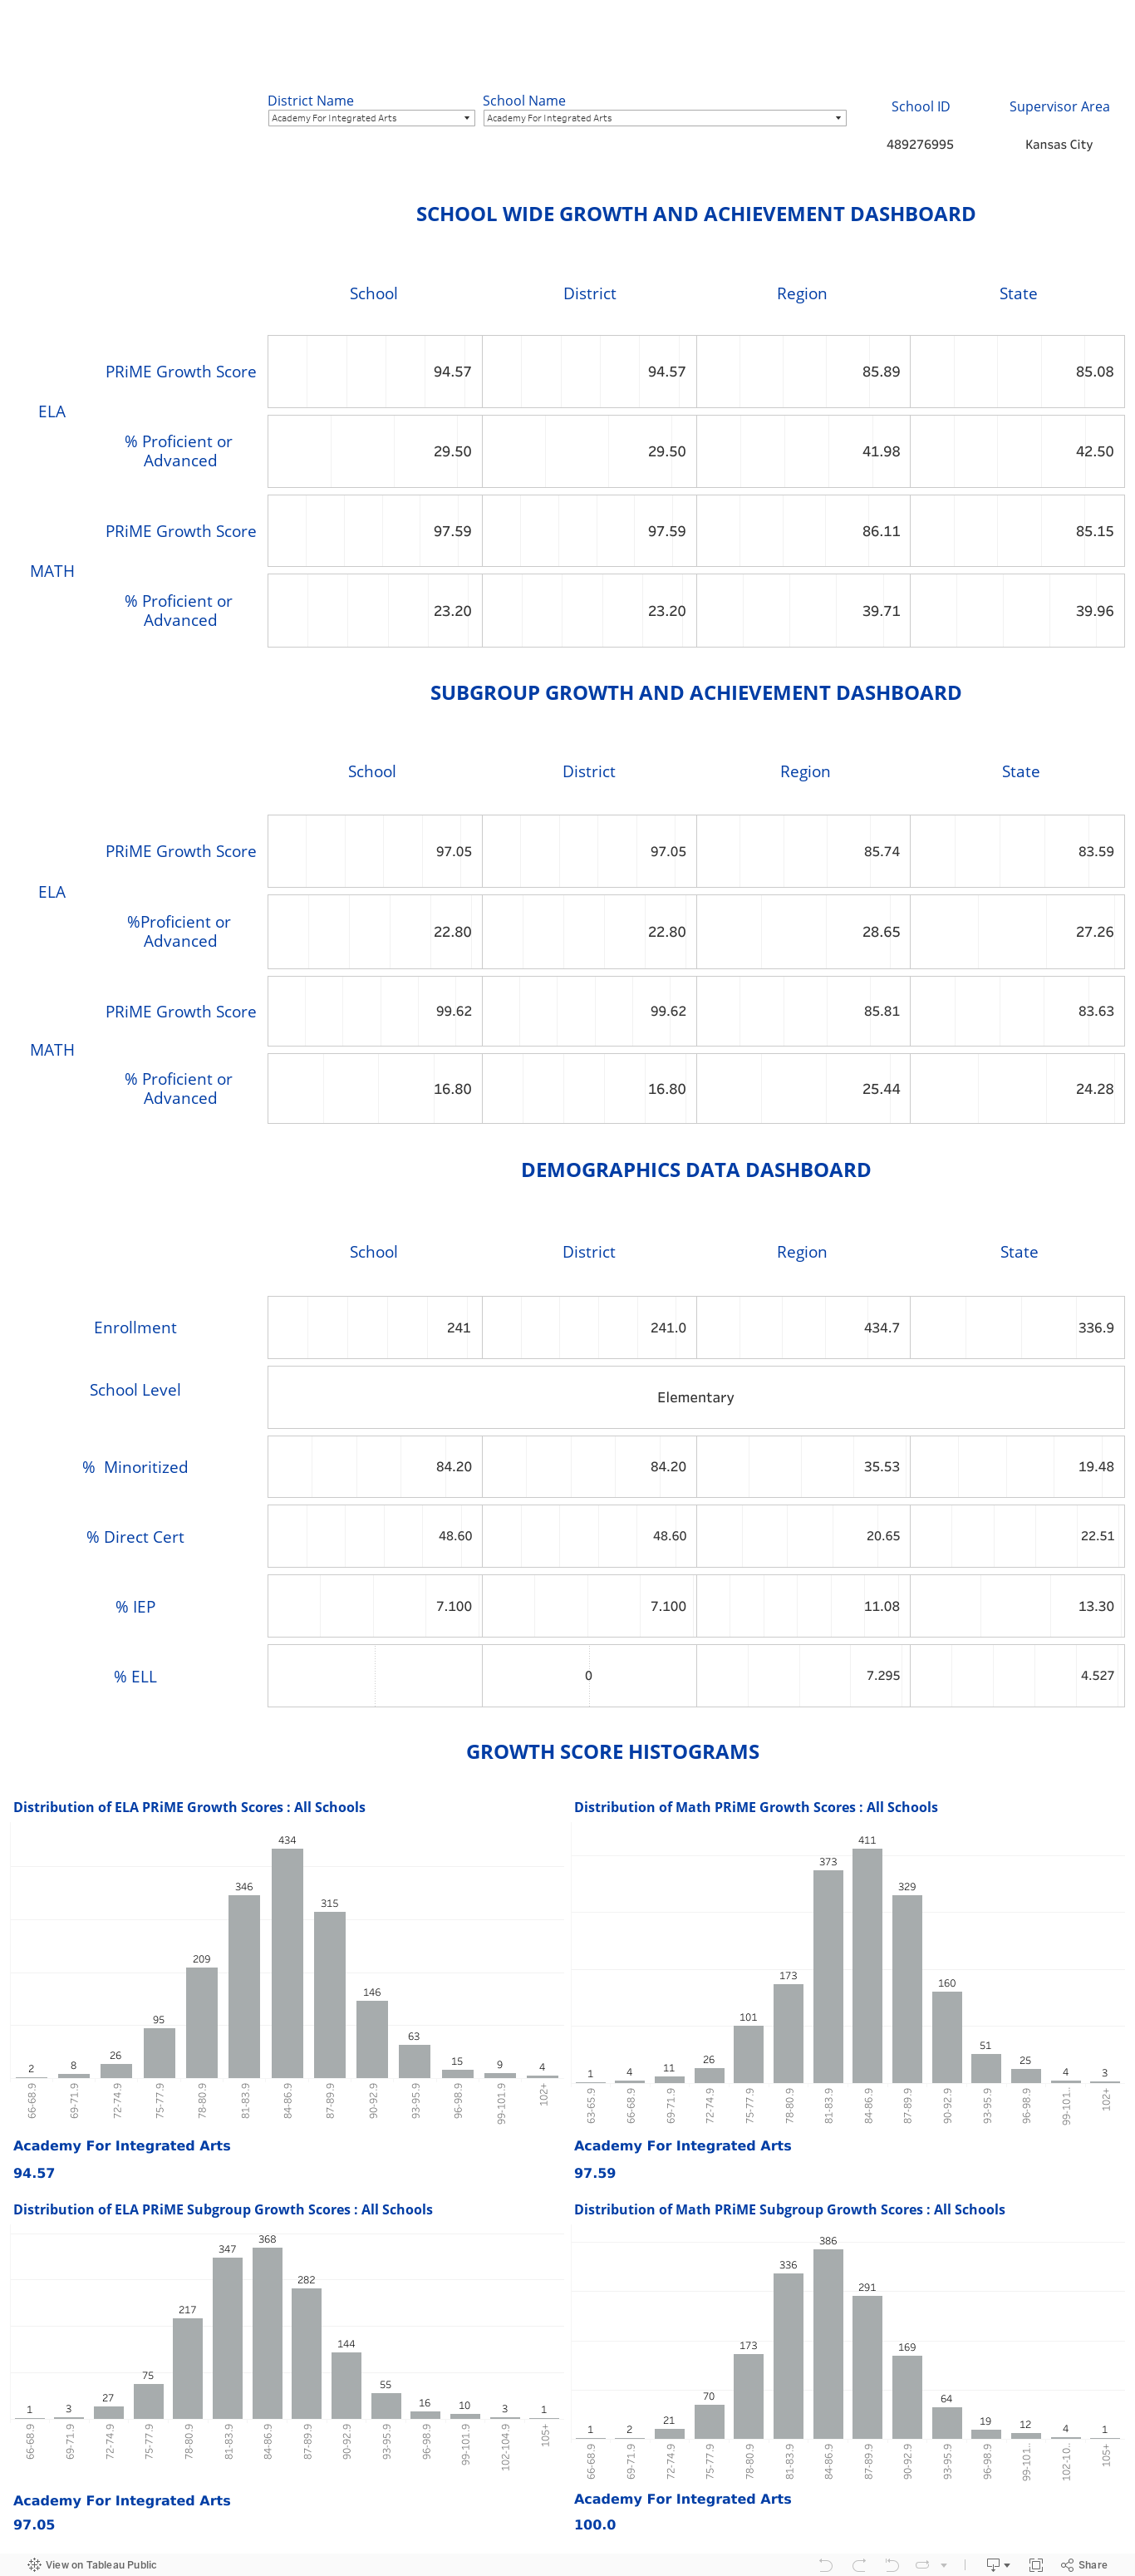
The histograms represent the distribution of scores across all represented schools in each category (Statewide ELA, Statewide Math, Subgroup ELA, and Subgroup Math). The ranges seen along the bottom of the graphs represent Growth Score ranges, while the numbers atop the bars represent how many schools had Growth Scores that fell within that range.