2020 Kansas City Education Profile
Education in the Kansas City Region
By: Evan Rhinesmith, Ph.D.
Today we are releasing our second annual Kansas City Regional Profile. Inside, you will find a 30,000-foot view of the inputs and outcomes of public school districts in the Kansas City supervisory region. Each public school and district in the state reports a variety of data to the state for accountability and financial purposes. This profile uses these data to provide a foundation for policymakers, families, and school personnel to better understand how the districts in the region are performing compared to one another and to the state. Policymakers might use this profile to better understand the contexts in which each district is operating and to discuss how to equitably allocate resources accordingly.
How is this year’s profile different? This year’s Kansas City profile is different in the following ways:
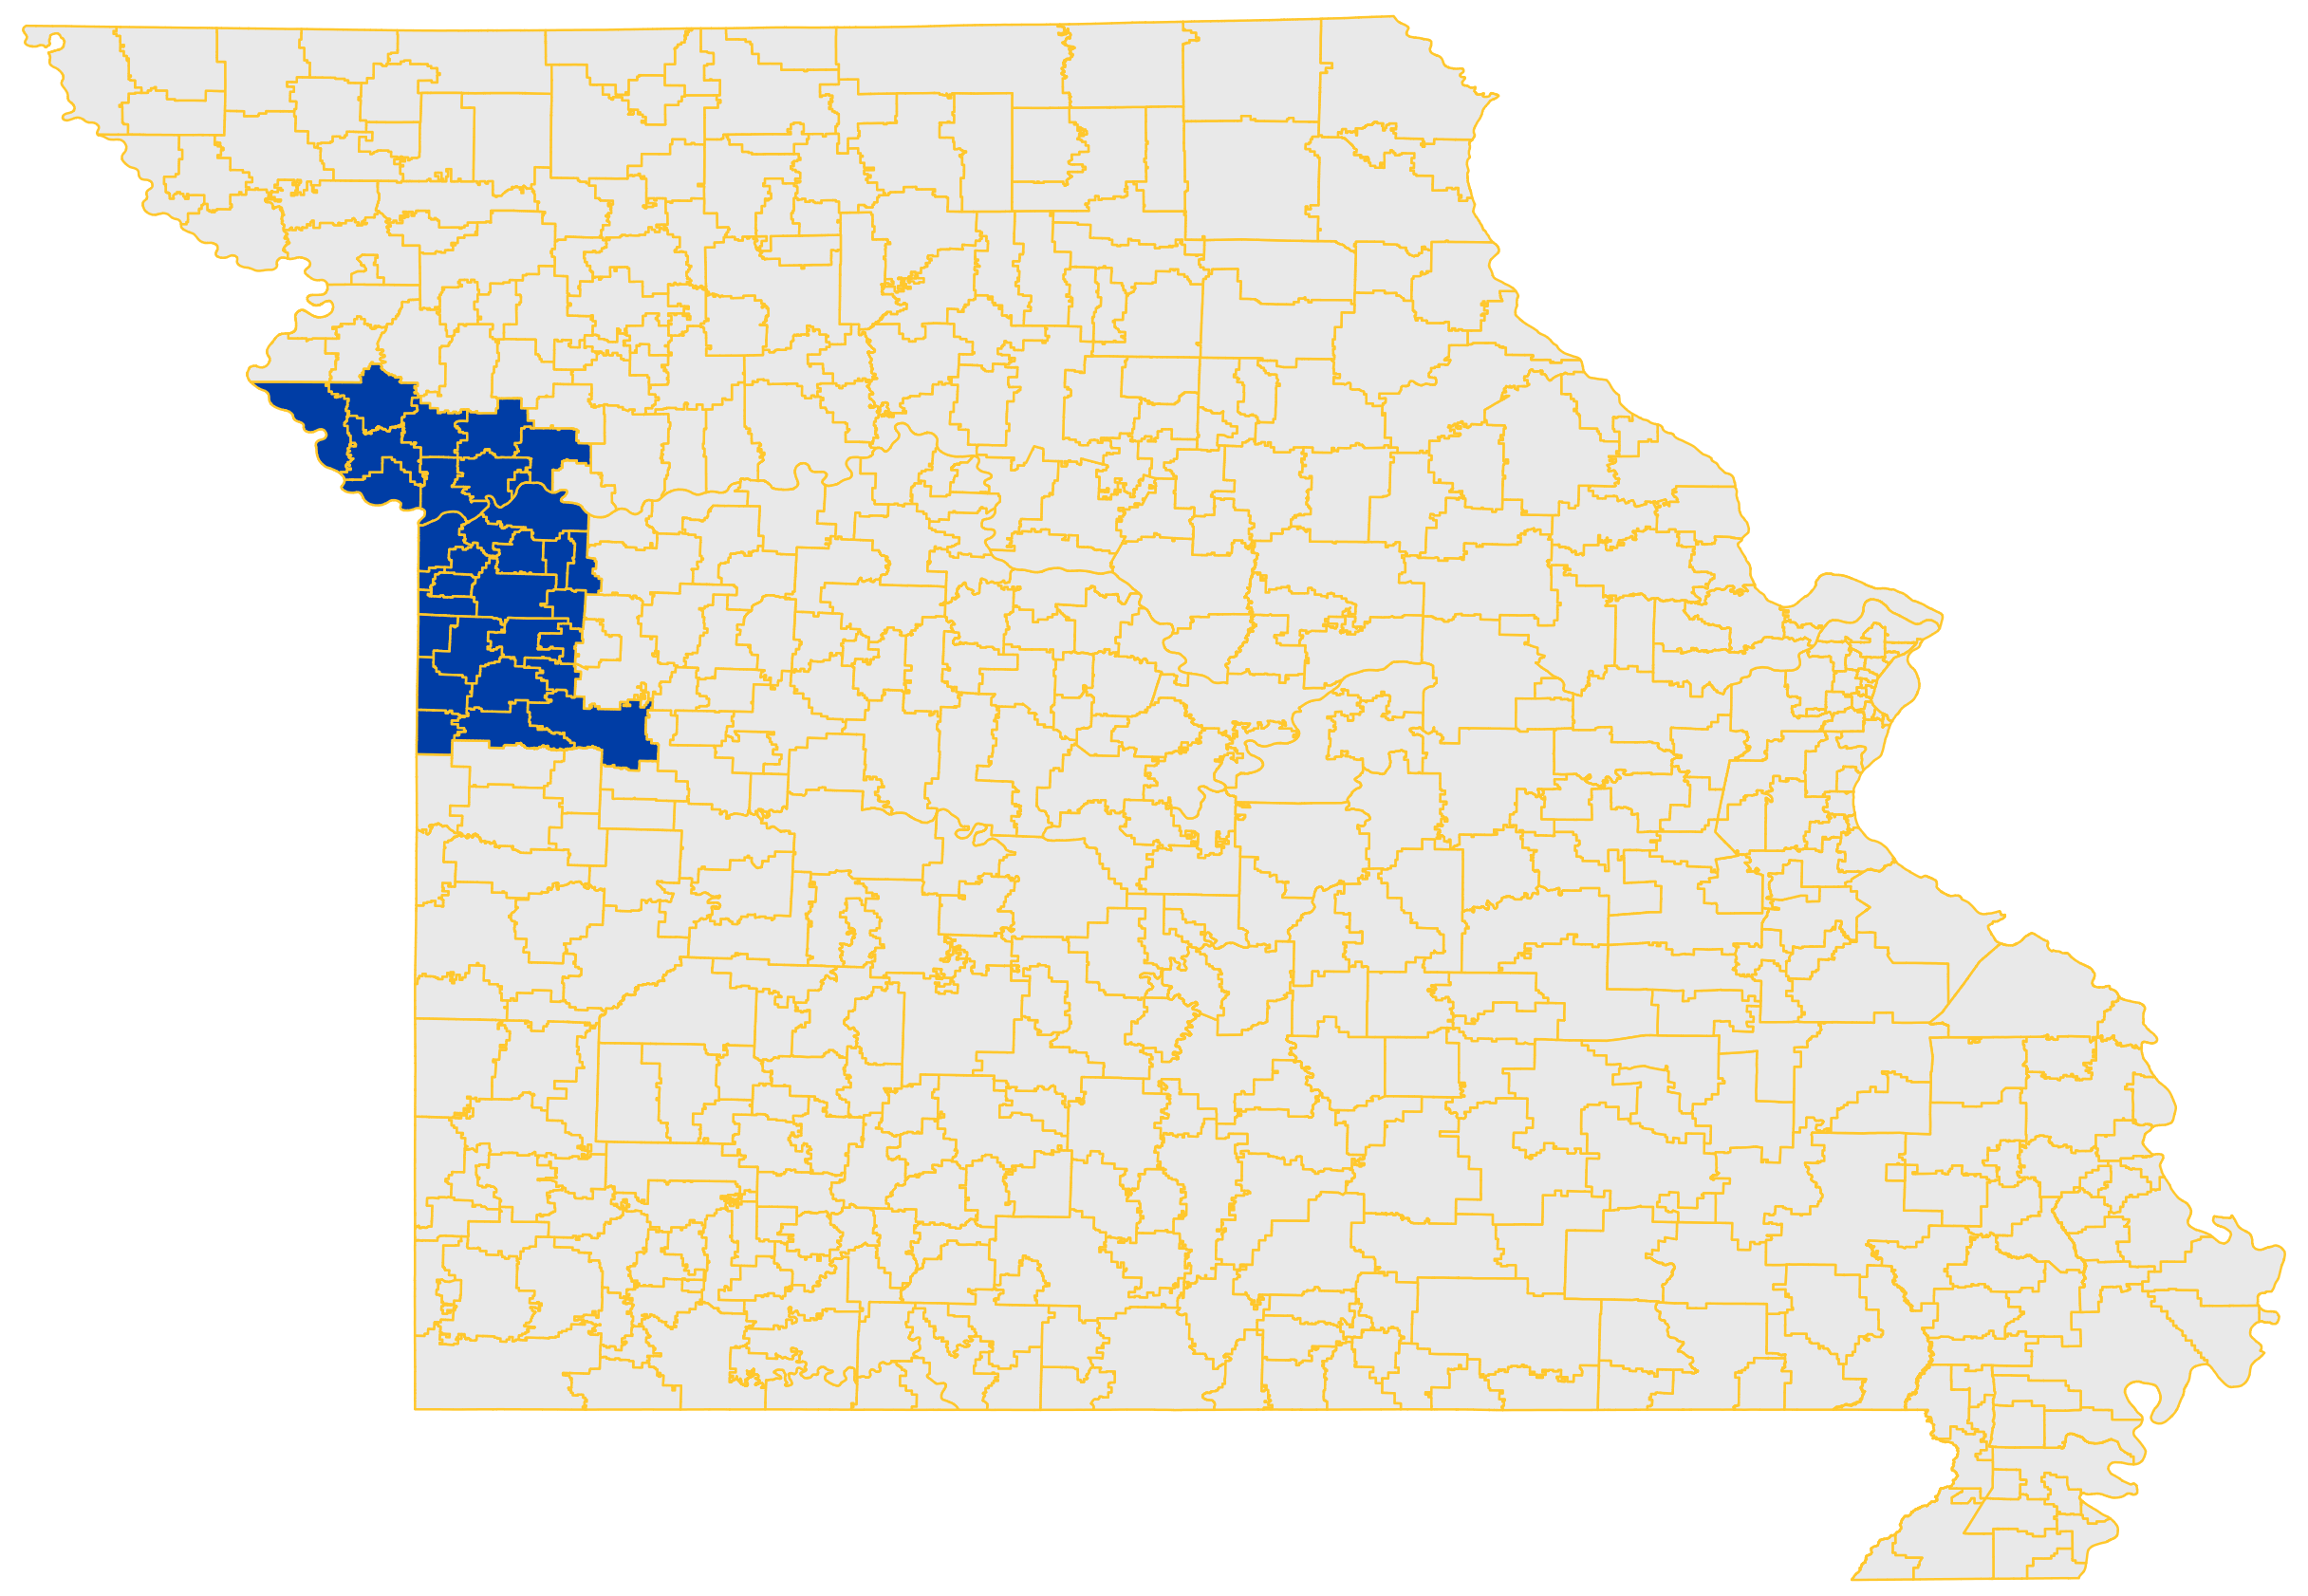
· Included fewer districts: This year, we included districts in Jackson, Platte, Cass, and Clay Counties, as well as Kansas City charter schools.
· Student demographics: We included the percentage of students who qualify for free lunch along with FRL-eligibility.
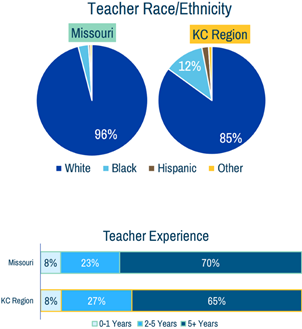
· Teacher demographics: We examine the racial demographics and percentage of teachers with different levels of experience.
· Student achievement: We examine 3rd-grade Communication Arts performance from 2015 through 2019 due to the state’s law regarding on-grade-level reading for third graders. We also show the ACT participation and average ACT score between 2015 and 2019, encompassing the three years where Missouri paid for ACT testing for all 11th graders.
· Additional data: This year’s profile includes additional data for each county as well as community context that might affect schools and students.
How did schools in the Kansas City region respond to COVID-19? In response to COVID-19, the state opted for fully distanced learning for the Spring of the 2019-20 school year. The state also opted to cancel MAP testing and heavily altered the data reporting and collection process. In the fall of the 2020-21 school year, 75% of districts began the years with an option for in-person learning. For a thorough examination of fall 2020 instruction across the state, please see PRiME’s Reopening Profile.
How much do districts spend? Districts in the region spend slightly below the state average, but the difference between districts is stark. Pleasant Hill spends $8,496 per student, whereas Missouri City 56—one of the state’s smallest school districts—spends $16,326. For charter schools, the per-pupil amount ranges from $10,614 at Académie Lafayette to $22,694 at Gordon Parks Elementary School.

Why does student mobility matter? We also examine student mobility, with particular attention to the percent of students who transfer. Students moving into and out of districts experience disruptions in their learning, and receiving districts are judged by how quickly they can get new students caught up. Therefore, districts with higher student mobility rates often have students who have experienced more disruptions in learning.

Who are Kansas City’s students? Compared to the state, the Kansas City region serves the second largest percentage of students of color. The region also has a wide range of student socioeconomic needs as measured by the percentage of students qualifying for the federal Free/Reduced-Price Lunch (FRL) program. School districts serving high percentages of FRL-eligible students may opt to participate in the Community Eligibility Provision (CEP). For an overview of studies on the CEP, read our report here.

Who teaches in the Kansas City Region? While many districts serve high concentrations of students of color, most districts employ a predominantly white staff. Additionally, districts with the highest concentrations of FRL-eligible students often have higher percentages of new (1 year of experience) and novice (2-5 years of experience) teachers.
How are Kansas City’s students performing on assessments? We pay special attention to the percent of third-grade students who score proficient and advanced on the third-grade communication arts assessment. Missouri law requires all students to read on grade level by the end of third grade.

We also examine the participation rates and average composite scores on the ACT between 2015 and 2019. This includes the years the state covered the test's cost, leading to nearly 100 percent participation statewide. Several school districts have maintained participation rates above 80 percent following the policy’s end while some districts saw their participation rates drop dramatically.

You can read the entire profile and see how your district or any other district in the Kansas City-area is doing by clicking the button below. If you think we should include different information for the 2021 profile, reach out to us or complete the attached survey. We hope these profiles provide useful information about education in Kansas City and inform the conversation to ensure each district can help all students in the Kansas City region realize their full potential.