Preliminary APR Release (Part II): Three Key Takeaways
By: Amy Shelton & Evan Rhinesmith, Ph.D.
Published On: October 28, 2019

Preliminary APR Release (Part II): Three Key Takeaways
APR Summary Reports were released in mid-October, and we published a brief guide to help navigate the new format. Today’s blog takes a big picture look at the data for Missouri districts and charters. Coverage of the results has already highlighted St. Louis area districts with the highest change in percent of students who are proficient and advanced, as well as urban districts across the state that are exceeding expectations for student growth. Reporting has also noted that the subgroup of English Language Learners is making the greatest gains in proficiency compared with state averages. We here at PRiME want to highlight three additional takeaways that we find important and hope to contribute to the conversation, with a particular focus on overall and subgroup growth.
Growth is a more important measure than achievement Status.
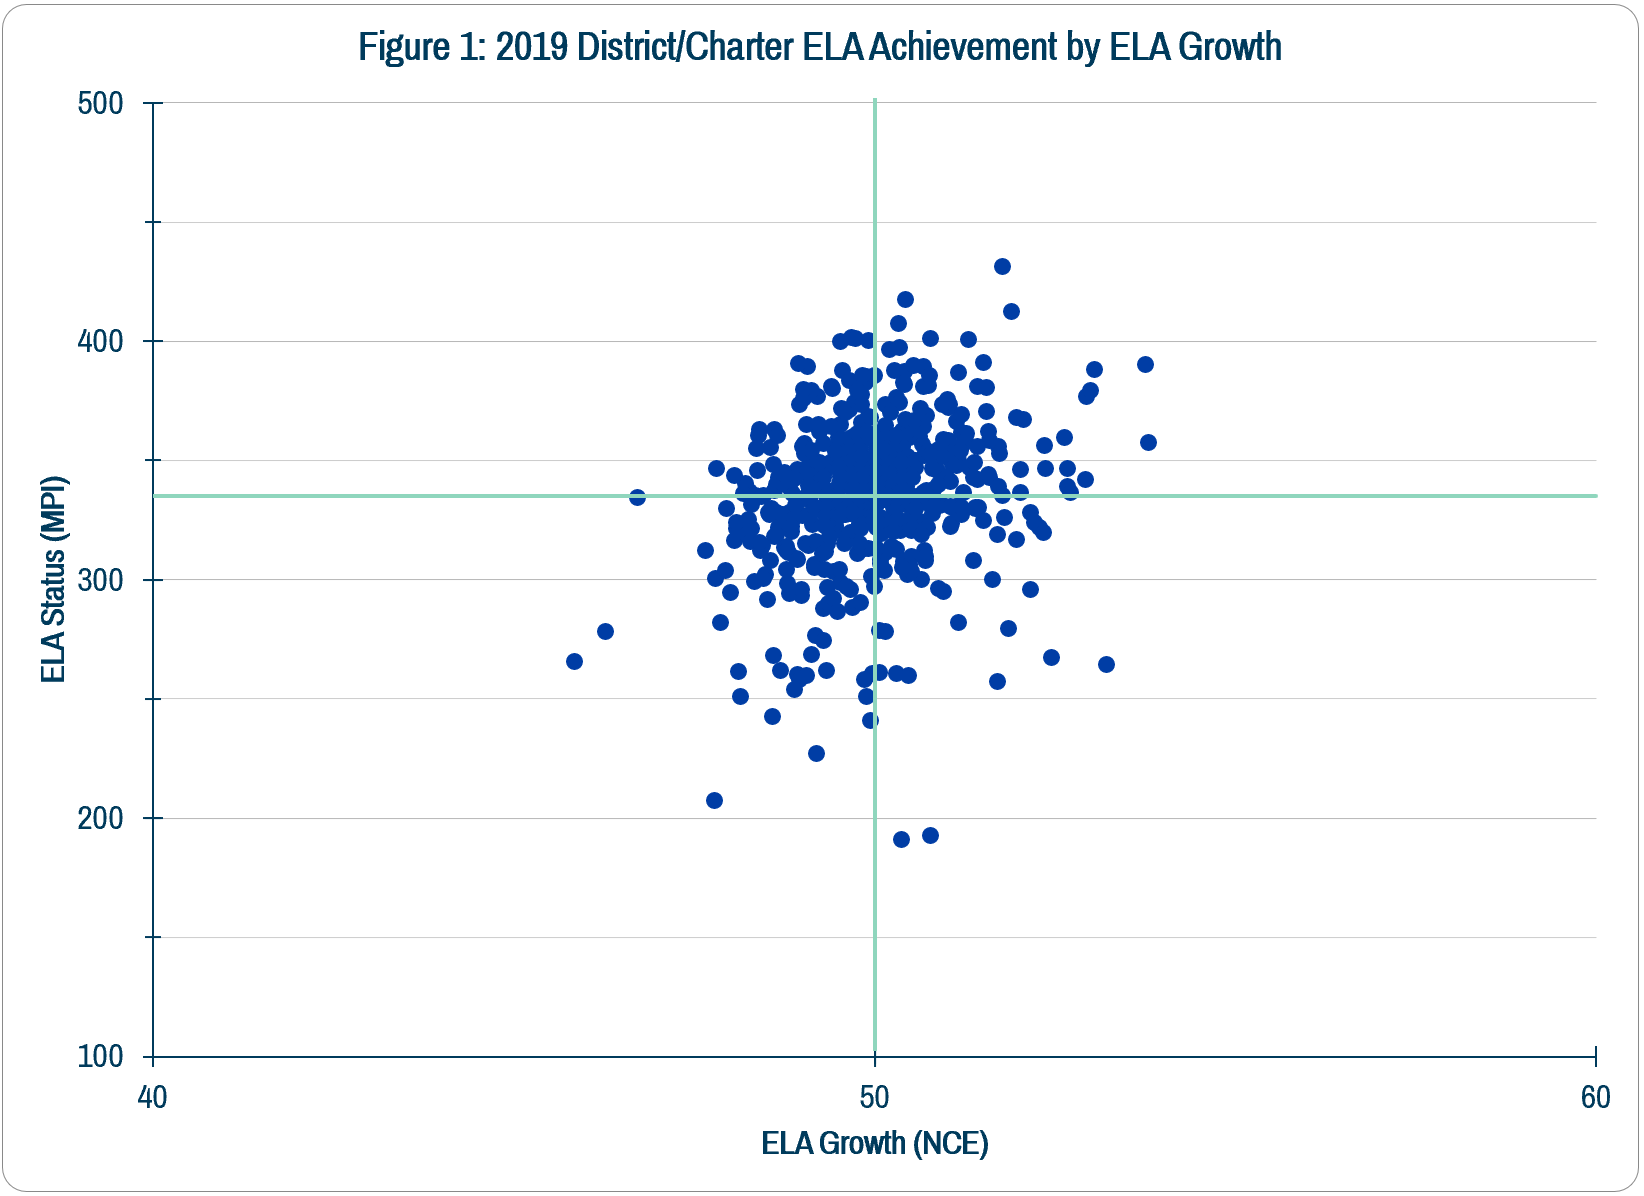
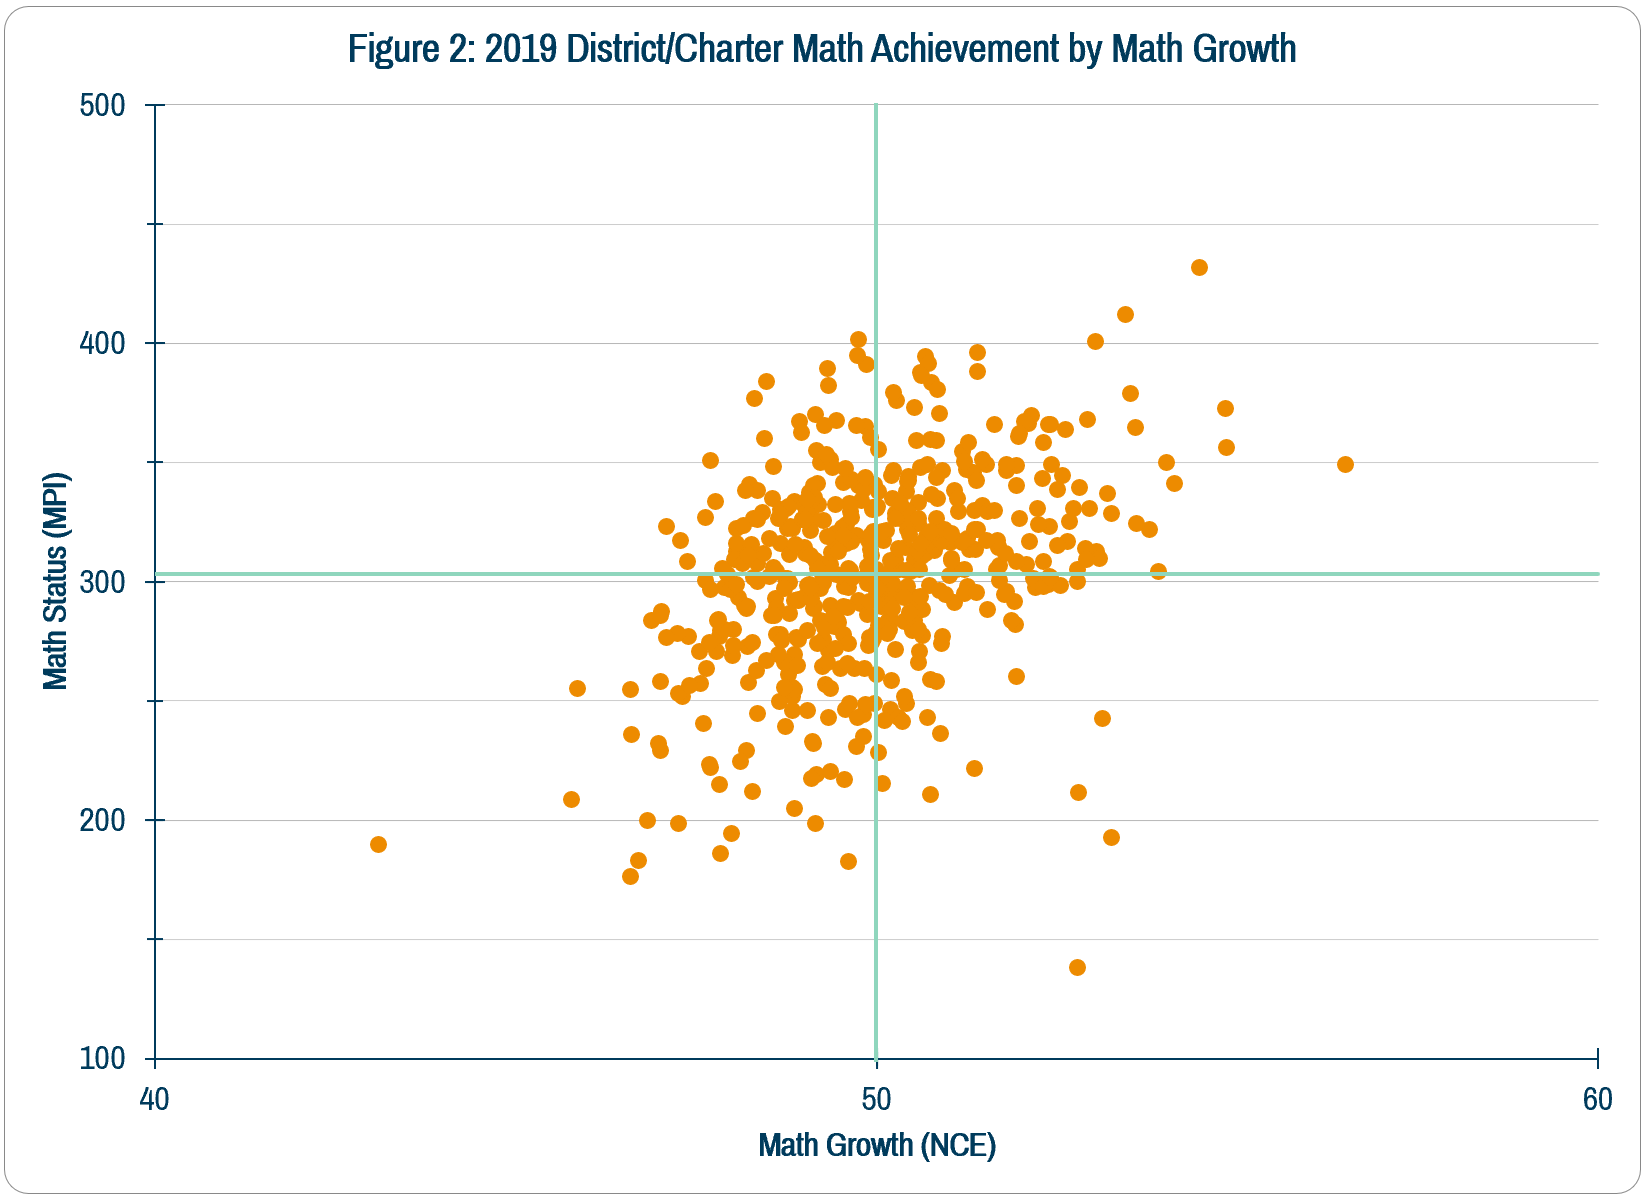
Stakeholders are often interested in the percent of students in a district or school who are proficient or advanced on state assessments. We noted in our previous blog that overall achievement remained relatively unchanged from last year, with more than half of Missouri students scoring below grade level in ELA and math. However, we think the primary focus of reporting and conversations should be on Growth rather than Status, which is determined by the MAP Performance Index (MPI). The MPI score, or Status score, simply reflects the scores of the students in a given school or district at one point in time, with no indication of where the students started or how much they grew or declined. In addition to MPI Status, Missouri has two measures related to growth, Growth and Progress. The Growth measure looks at the improvement of individual student test scores from one year to the next, while Progress looks at whether the district or school is making improvements over time. 73 percent of districts and charters are On Track or Exceeding state expectations in ELA student growth, and 67 percent are On Track or Exceeding in math growth. While achievement Status can be affected by many factors outside of the school context, Growth can be attributed more directly to the impact of the district or school.
In the figures below, we’ve plotted every district’s Status and Growth on the 2018-19 MAP ELA and math assessments. The axes are placed at the state average MPI achievement Status score and state average NCE Growth value. This allows us to see how each district has performed in both achievement and growth compared to the state. The likely goal for most districts and schools is to land in the upper right quadrant, where students exhibit high levels of achievement and growth. Conversely, districts and schools want to avoid being in the bottom left where there is low achievement and low growth. Schools and districts in the top left are exhibiting high achievement, but are not showing year-over-year growth. The bottom right shows districts that are exhibiting low levels of achievement, but whose students have made positive gains compared to last year. It's important for these districts in the bottom right to maintain their positive momentum in the hopes of reaching the top-right quadrant.
Achievement Status is greatly impacted by socioeconomic disadvantage, as measured by the percent of students in the district or charter eligible for Free-or-Reduced-Price Lunch (FRL).
District and charter ELA and math achievement generally decreases as the percentage of FRL-eligible students increases. One reason we don’t focus on the MPI Status measure is that it is so clearly related to the socioeconomic background of students.
However, it is worth noting that there is a wide range in achievement among the fifty-one districts and charters that are 100 percent FRL-eligible. Four of the 100 percent FRL-eligible districts and charters are performing above the state average in ELA, and five are performing above the state average in math (Potosi R-III and North Side Community School are performing above the state average in both).

There is great variation among districts and charters in ELA and math growth.
Growth is more independent of FRL percentage than is Status. This year 49 districts and charters exceeded state expectations for growth in both ELA and math and also exceeded state expectations for subgroup growth in both subjects. Subgroups are those that have historically achieved below state averages, such as FRL-eligible students, black students, Hispanic students, English language learners, and students on Individualized Education Plans (IEPs). Table 1 below shows that the districts and charters exceeding expectations for student growth vary greatly in their context and demographics, and it will be valuable for us as a state to examine what these districts and charters are doing differently.
Conclusion
Conversations about district and school quality are often related to the percent of students who are scoring on grade level in ELA and math. However, we believe the Growth measure is a better assessment than is Status of the effectiveness of Missouri districts and schools and hope that as a state we will continue to shine a light on districts and schools that are making the most difference for kids.

City:
Rural:
Suburb:
Town:
Charter:
MORE FROM THE PRiME BLOGS


The PRiME Center provides an updated analysis of high school start times across the state of Missouri.