Missouri's Quality Counts 2020, Part 2

Quality Counts 2020, Finance
By: Evan Rhinesmith, Ph.D.
Education Week (EdWeek) has released the second portion of its annual Quality Counts report, this time grading states on K-12 education finance. The first piece in the three-part series looked at the Chance for Success Index, which is designed to provide “a snapshot of a person’s prospect of successful outcomes over a lifetime, from early childhood to adulthood and the working world.” Missouri slightly outperformed the national average, earning a C+ grade and ranking 26th. You can read more about what went into Missouri’s grade in our first Quality Counts blog.
Missouri’s School Finance earns a C- grade and ranked 32nd overall.
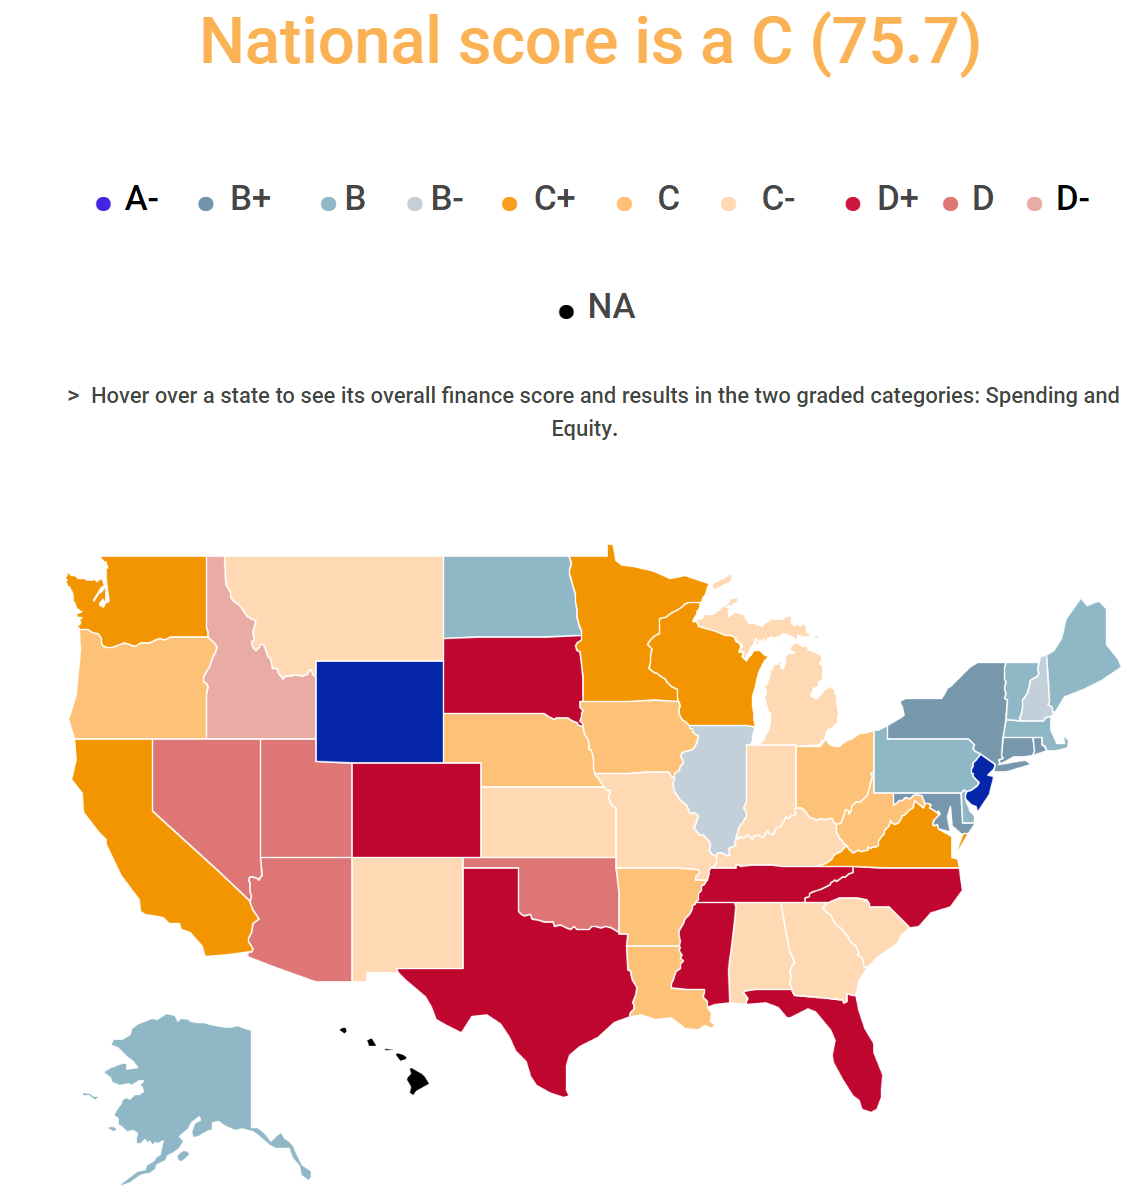
This is the same grade we received in 2019, while our ranking improved two places. Missouri’s performance is below the national average in terms of points earned (71.3 versus 75.7) and is a lower grade (C- versus C). Compared to our neighboring states, we outperformed Tennessee, Kentucky, and Oklahoma, while trailing Illinois, Iowa, Kansas, Nebraska, and Arkansas.
What goes into the Finance grades?
EdWeek’s grading for finance is based on overall spending for K-12 education and a measure of equity that is focused on “how fairly and evenly that money is distributed throughout a particular state.” Finance grades are based on data from the U.S. Census Bureau, Department of Commerce, and other sources that help EdWeek take a detailed look at spending. States are then graded on eight separate indicators based on the amount spent and how it is spent, as described in Table 1.

Source: EdWeek
The Good and the Bad for Missouri School Finance, According to EdWeek
According to EdWeek, Missouri spends more equitably than the national average, albeit slightly. However, when taken in context with the amount spent, this shows that Missouri spends a low amount on education across districts. This is evidenced by the good scores on the McLoone Index (how many districts are spending at least at the midpoint compared to other districts), Coefficient of Variation (how close together spending amounts are across districts), and the Restricted Range (the gap between the highest- and lowest-funded districts), but a very low Wealth-Neutrality Index (poor districts receiving less funding than wealthy districts).
Similar to the results of the “Chance for Success Index”, the indicators within each category appear related to one another. Therefore, a low score on one indicator will lead to a low score on another. If we look at the Spending category, Missouri’s average school district spent $1,100 less than the national average. Because of this, few students (11.4%) in Missouri enroll in districts that spend at or above the national average and few districts spend at or close to the national average (Spending Index). So, Missouri’s rankings of 31st, 35th, and 34th on three of the four Spending indicators should come as no surprise.
Why Spending Matters
Along with the Quality Counts results, EdWeek provided the results of a district leader survey on school finance as a result of the COVID-19 pandemic. Among the respondents to the survey, over half (56%) believed their district would spend less next year as a result of the shutdown. This is already coming to fruition in Missouri, as the state announced $172 million in cuts to the education budget. While we’ve never faced a crisis of this magnitude before, we have lessons from the Great Recession that can give us some idea of how this might impact our schools.
A recent study from Northwestern University examined how budget and spending cuts for education impacted students during the Great Recession, finding that students who attended school during a financial crisis had lower test scores and were less likely to enroll in college. These cuts had a particularly negative impact on students in poor neighborhoods and increased Black-White test score gaps. Additionally, a review of research on school spending finds that studies examining increased school spending consistently result in improved outcomes for students.
Taken together, it is likely that Missouri’s Quality Counts scores will stay--at best--stagnant following the budget cuts. Gaps in spending are likely to increase, while gaps in spending equity will likely widen. But, more importantly, students will bear the brunt of these cuts.
Education Spending in Missouri
This report provides EdWeek’s rating of the amount spent on education in the US and whether these amounts are spent equitably. Much like the “Chance for Success Index”, this is an enormous undertaking to collect and analyze data on public school districts across all 50 states. These data are useful in that we can understand more of the nuance associated with school spending.
However, we believe there are issues with the system they have put in place. EdWeek itself even points out some of the counterintuitive results observed, as Alaska has the best Wealth-Neutrality Index score (poor districts receiving more money than wealthy ones) but also has the largest gap between the highest- and lowest-spending districts at $21,000. Additionally, as we pointed out above, states can be low-spending but still be viewed as equitable. Missouri is a great example of this, as we received a failing grade in spending but got a B+ in Equity. This shows that we do not spend very much, but at least all of our districts equally low-spending. With historical trends of low spending and pending budget cuts, it seems unlikely we will see increased spending any time soon and likely will see suffering performance.